CSVReadEdit
Repository source: CSVReadEdit

Description
This example loads a CSV file, edits it, then visualizes the result.
It demonstrates the use of pandas to read and edit the CSV input file, then uses numpy and the vtk-numpy interface for building the resultant vtkPolyData object based on the options selected.
The key thing about pandas is it can read/write data in various formats: CSV and text files, Microsoft Excel, SQL databases, and the fast HDF5 format. It is highly optimized for performance and the DataFrame object allows for extensive row/column manipulation. So we can edit the data, creating new columns, and, finally, select only relevant columns for further analysis by VTK.
In this case we select columns using numpy to create the three-dimensional point data array data. The numpy objects are then converted to vtk data structures and integrated into a vtkPolyData object.
The process is this:
CSV->pandas(read/edit/select)->numpy->numpy_to_vtk->vtkPolyData
Note how easy it is the get the three-dimensional coordinates using numpy.
The files used to generate the example are:
<DATA>/LakeGininderra.csv
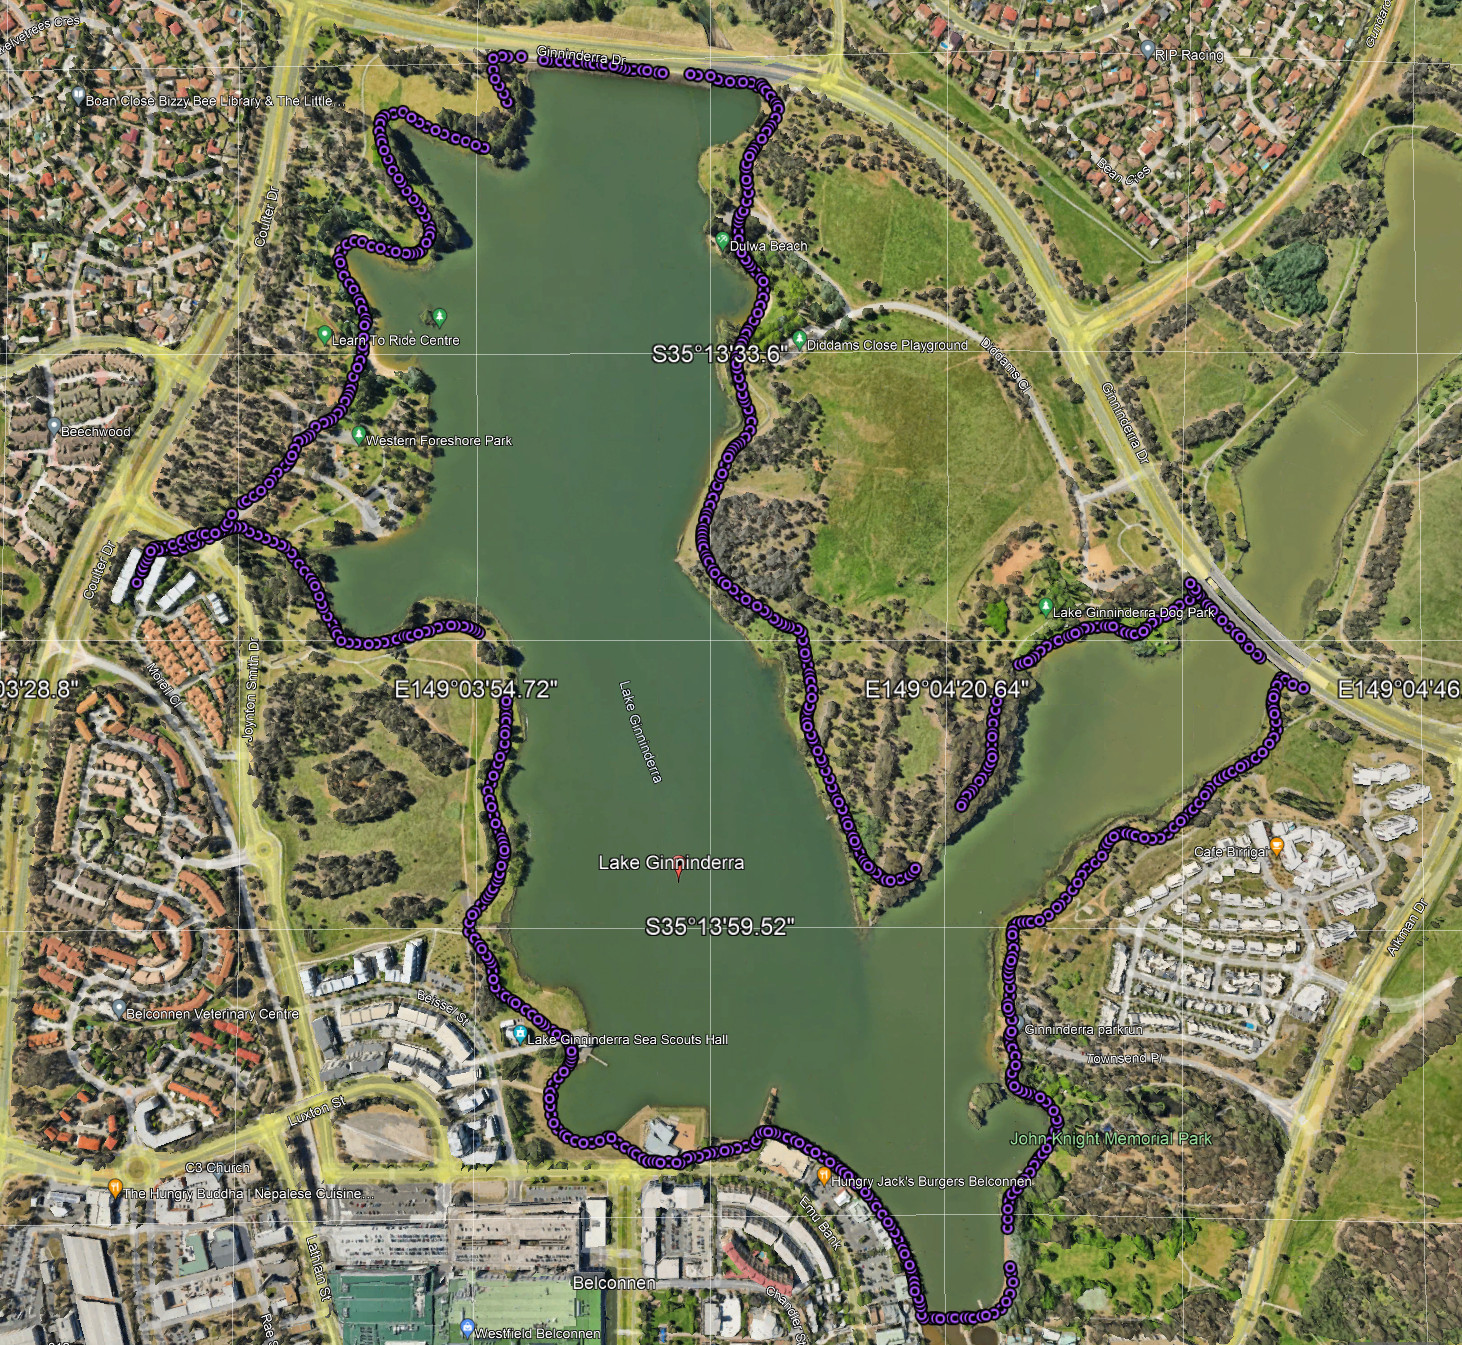
<DATA>/LakeGininderra.kmz
Where:
<DATA>is the path tovtk-examples/src/Testing/DataLakeGininderra.csvis the CSV file used by this program.LakeGininderra.kmzcan be loaded into Google Earth to display the track.
The parameters for typical usage are something like this:
Note that LakeGininderra.csv contains the Geographic, UTM and ECEF coordinates.
<DATA>/LakeGininderra.csv -u -c -pResults
Further information:
Other languages
See (PythonicAPI)
Question
If you have a question about this example, please use the VTK Discourse Forum
Code
CSVReadEdit.py
#!/usr/bin/env python3

from pathlib import Path

import pandas as pd
# noinspection PyUnresolvedReferences
import vtkmodules.vtkInteractionStyle
# noinspection PyUnresolvedReferences
import vtkmodules.vtkRenderingOpenGL2
from vtk.util import numpy_support
from vtkmodules.vtkCommonColor import (
    vtkNamedColors
)
from vtkmodules.vtkCommonCore import vtkLookupTable, vtkPoints
from vtkmodules.vtkCommonDataModel import (
    vtkCellArray,
    vtkPolyData,
    vtkPolyLine
)
from vtkmodules.vtkCommonTransforms import vtkTransform
from vtkmodules.vtkFiltersGeneral import vtkTransformPolyDataFilter
from vtkmodules.vtkIOXML import vtkXMLPolyDataWriter
from vtkmodules.vtkInteractionStyle import vtkInteractorStyleTrackballCamera
from vtkmodules.vtkInteractionWidgets import vtkCameraOrientationWidget, vtkOrientationMarkerWidget
from vtkmodules.vtkRenderingAnnotation import vtkAxesActor, vtkScalarBarActor
from vtkmodules.vtkRenderingCore import (
    vtkActor,
    vtkColorTransferFunction,
    vtkPolyDataMapper,
    vtkRenderWindow,
    vtkRenderWindowInteractor,
    vtkRenderer
)


def get_program_parameters():
    import argparse
    description = 'Edit data from a CSV file and visualise it.'
    epilogue = '''
    This program selects ECEF, Geographic or UTM coordinates from the input file and:
       1) Visualises the resultant ECEF or UTM points and lines.
       2) If ECEF or UTM is selected, optionally creates and saves a VTP file for further analysis.
       3) Optionally saves the CSV file.
    If Geographic coordinates are selected, only the resultant CSV file can be saved.
    '''
    parser = argparse.ArgumentParser(description=description, epilog=epilogue,
                                     formatter_class=argparse.RawTextHelpFormatter)
    parser.add_argument('file_name', help='The CSV file containing the data.')
    parser.add_argument('-c', '--csv', action='store_true', help='Save the resultant CSV file.')
    parser.add_argument('-v', '--vtp', action='store_true', help='Save the .vtp file.')
    parser.add_argument('-p', '--path', default='.',
                        help='The path to be appended to the .vtp and optional .csv file')

    group = parser.add_mutually_exclusive_group(required=True)
    group.add_argument('-e', '--ecef', action='store_true', help='Use ECEF coordinates.')
    group.add_argument('-u', '--utm', action='store_true', help='Use UTM coordinates.')
    group.add_argument('-g', '--geo', action='store_true', help='Use geographic coordinates (latitude/longitude).')

    args = parser.parse_args()
    return args.file_name, args.csv, args.vtp, args.path, args.ecef, args.utm, args.geo


def main():
    ifn, csv, vtp, sp, ecef, utm, geo = get_program_parameters()
    file_name = Path(ifn)
    if not file_name.is_file():
        print('Unable to read:', file_name)
        return
    pth = Path(sp)
    if not pth.is_dir():
        if pth.is_file():
            print(sp, ' must be a path')
            return
    pth.mkdir(parents=True, exist_ok=True)

    # Build the output paths.
    csv_fn = Path(pth / Path(ifn).stem).with_suffix('.csv')
    vtp_fn = Path(pth / Path(ifn).stem).with_suffix('.vtp')
    if ecef:
        vtp_fn = vtp_fn.with_stem(vtp_fn.stem + '_ecef')
    if utm:
        vtp_fn = vtp_fn.with_stem(vtp_fn.stem + '_utm')

    # Create a DataFrame from the csv file.
    df = pd.read_csv(file_name)

    # Use the column called 'Index' as the index.
    # This ensures that we can trace back each row to the original data.
    df.set_index('Index', inplace=True)

    # For ECEF coordinates, we want to look down from the zenith.
    # So calculate the mid-point of the latitude.
    lat_details = df['Latitude'].describe()
    lat_mid_pt = (lat_details['max'] + lat_details['min']) / 2

    dfv = None
    # Copy what we want to a new DataFrame and drop any rows with missing values.
    if ecef:
        dfv = df[['X(m)', 'Y(m)', 'Z(m)', 'Elevation(m)']].dropna(
            subset=['X(m)', 'Y(m)', 'Z(m)'])
        if csv:
            ecef_csv_fn = csv_fn.with_stem(csv_fn.stem + '_ecef')
            dfv.to_csv(ecef_csv_fn, index=True, index_label='Index', header=True)
    elif utm:
        dfv = df[['Easting(m)', 'Northing(m)', 'Elevation(m)']].dropna(
            subset=['Easting(m)', 'Northing(m)', 'Elevation(m)'])
        # Duplicate the elevation column, this will become the z-coordinate when UTM is selected.
        dfv['Elev'] = dfv.loc[:, 'Elevation(m)']
        if csv:
            utm_csv_fn = csv_fn.with_stem(csv_fn.stem + '_utm')
            dfv.to_csv(utm_csv_fn, index=True, index_label='Index', header=True)
    else:
        df_geo = df[['Longitude', 'Latitude', 'Elevation(m)']].dropna(
            subset=['Longitude', 'Latitude', 'Elevation(m)'])
        geo_csv_fn = csv_fn.with_stem(csv_fn.stem + '_geo')
        df_geo.to_csv(geo_csv_fn, index=True, index_label='Index', header=True)

    if ecef:
        xyz = dfv[['X(m)', 'Y(m)', 'Z(m)']].to_numpy()
    elif utm:
        xyz = dfv[['Easting(m)', 'Northing(m)', 'Elevation(m)']].to_numpy()
    else:
        print('Only ECEF or UTM coordinates can be visualised.')
        return

    elev = df[['Elevation(m)']].to_numpy()

    # Create the poly data.
    poly_data = vtkPolyData()
    points = vtkPoints()
    points.SetData(numpy_support.numpy_to_vtk(xyz))
    poly_data.SetPoints(points)

    # Set an index
    idx = numpy_support.numpy_to_vtk(elev)
    idx.SetName('Index')
    poly_data.GetPointData().AddArray(idx)

    # We use the elevation as the active scalars.
    scal = numpy_support.numpy_to_vtk(elev)
    scal.SetName('Elevation(m)')
    poly_data.GetPointData().SetScalars(scal)
    poly_data.GetPointData().SetActiveScalars('Elevation(m)')
    elev_range = poly_data.GetPointData().GetScalars().GetRange()

    num_pts = poly_data.GetNumberOfPoints()
    poly_line = vtkPolyLine()
    poly_line.GetPointIds().SetNumberOfIds(num_pts)
    for i in range(0, num_pts):
        poly_line.GetPointIds().SetId(i, i)

    # Create a cell array to store the lines in and add the lines to it.
    cells = vtkCellArray()
    cells.InsertNextCell(poly_line)

    # Add the lines to the dataset
    poly_data.SetLines(cells)

    poly_data.Modified()

    # Rotate the ECEF coordinates
    # into VTK coordinates so that on the screen:
    # Y points North, X points East and Z points up.
    transform = vtkTransform()
    if utm:
        # Scale the elevation.
        transform.Scale(1, 1, 1)
    if ecef:
        # Rotate the ECEF coordinates
        # into VTK coordinates so that on the screen:
        # Y points North, X points East and Z points up.
        transform.RotateX(-(90 - lat_mid_pt))
        transform.RotateY(0)
        transform.RotateZ(90 - lat_mid_pt)

    transform_filter = vtkTransformPolyDataFilter()
    transform_filter.SetInputDataObject(poly_data)
    transform_filter.SetTransform(transform)
    transform_filter.Update()

    if vtp:
        writer = vtkXMLPolyDataWriter()
        writer.SetFileName(vtp_fn)
        writer.SetInputConnection(transform_filter.GetOutputPort())
        writer.SetDataModeToBinary()
        writer.Write()

    colors = vtkNamedColors()
    colors.SetColor("ParaViewBkg", [82, 87, 110, 255])

    lut = get_diverging_lut('cool_warm')
    # lut = get_diverging_lut1('DarkRed', 'Gainsboro', 'Green')

    mapper = vtkPolyDataMapper()
    mapper.SetInputConnection(transform_filter.GetOutputPort())
    mapper.SetScalarRange(elev_range)
    mapper.SetLookupTable(lut)
    mapper.ScalarVisibilityOn()

    actor = vtkActor()
    actor.SetMapper(mapper)

    window_width = 1024
    window_height = 1024

    # Create a scalar bar
    scalar_bar = vtkScalarBarActor()
    scalar_bar.SetLookupTable(mapper.GetLookupTable())
    scalar_bar.SetTitle('Elevation')
    scalar_bar.UnconstrainedFontSizeOff()
    scalar_bar.SetNumberOfLabels(6)
    scalar_bar.SetVerticalTitleSeparation(50)
    scalar_bar.SetMaximumWidthInPixels(window_width // 8)
    scalar_bar.SetMaximumHeightInPixels(window_height // 2)
    scalar_bar.SetBarRatio(scalar_bar.GetBarRatio() * 0.5)
    scalar_bar.SetPosition(0.87, 0.1)

    renderer = vtkRenderer()
    ren_win = vtkRenderWindow()
    ren_win.AddRenderer(renderer)
    ren_win.SetSize(window_width, window_height)
    if ecef:
        ren_win.SetWindowName('ECEF')
    elif utm:
        ren_win.SetWindowName('UTM')
    iren = vtkRenderWindowInteractor()
    iren.SetRenderWindow(ren_win)
    style = vtkInteractorStyleTrackballCamera()
    iren.SetInteractorStyle(style)

    renderer.AddActor(actor)
    renderer.AddActor(scalar_bar)
    renderer.SetBackground(colors.GetColor3d('ParaViewBkg'))

    cam_orient_manipulator = vtkCameraOrientationWidget()
    cam_orient_manipulator.SetParentRenderer(renderer)
    cam_orient_manipulator.On()

    axes = vtkAxesActor()
    axes.SetXAxisLabelText('East')
    axes.SetYAxisLabelText('North')
    # Zenith
    axes.SetZAxisLabelText('Zenith')

    widget = vtkOrientationMarkerWidget()
    rgba = [0] * 4
    colors.GetColor('Carrot', rgba)
    widget.SetOutlineColor(rgba[0], rgba[1], rgba[2])
    widget.SetOrientationMarker(axes)
    widget.SetInteractor(iren)
    widget.SetViewport(0.0, 0.0, 0.2, 0.2)
    widget.SetEnabled(1)
    widget.InteractiveOn()

    renderer.ResetCamera()
    renderer.GetActiveCamera().Elevation(0)

    iren.Initialize()

    ren_win.Render()
    iren.Start()


def get_diverging_lut(color_map: str, table_size: int = 256):
    """
    See: [Diverging Color Maps for Scientific Visualization](https://www.kennethmoreland.com/color-maps/)
                       start-point         mid-point           end-point\n
    cool to warm:     0.230, 0.299, 0.754 0.865, 0.865, 0.865 0.706, 0.016, 0.150\n
    purple to orange: 0.436, 0.308, 0.631 0.865, 0.865, 0.865 0.759, 0.334, 0.046\n
    green to purple:  0.085, 0.532, 0.201 0.865, 0.865, 0.865 0.436, 0.308, 0.631\n
    blue to brown:    0.217, 0.525, 0.910 0.865, 0.865, 0.865 0.677, 0.492, 0.093\n
    green to red:     0.085, 0.532, 0.201 0.865, 0.865, 0.865 0.758, 0.214, 0.233\n

    :param color_map: The color map to use e.g. cool_warm.
    :param table_size: The table size.
    :return:
    """
    color_maps = dict()
    color_maps['cool_warm'] = {'start': (0.230, 0.299, 0.754), 'mid': (0.865, 0.865, 0.865),
                               'end': (0.706, 0.016, 0.150)}
    color_maps['purple_orange'] = {'start': (0.436, 0.308, 0.631), 'mid': (0.865, 0.865, 0.865),
                                   'end': (0.759, 0.334, 0.046)}
    color_maps['green_purple'] = {'start': (0.085, 0.532, 0.201), 'mid': (0.865, 0.865, 0.865),
                                  'end': (0.436, 0.308, 0.631)}
    color_maps['blue_brown'] = {'start': (0.217, 0.525, 0.910), 'mid': (0.865, 0.865, 0.865),
                                'end': (0.677, 0.492, 0.093)}
    color_maps['green_red'] = {'start': (0.085, 0.532, 0.201), 'mid': (0.865, 0.865, 0.865),
                               'end': (0.758, 0.214, 0.233)}

    ctf = vtkColorTransferFunction()
    ctf.SetColorSpaceToDiverging()
    cm = color_maps[color_map]

    ctf.AddRGBPoint(0.0, *cm['start'])
    ctf.AddRGBPoint(0.5, *cm['mid'])
    ctf.AddRGBPoint(1.0, *cm['end'])

    lut = vtkLookupTable()
    lut.SetNumberOfTableValues(table_size)
    lut.Build()

    for i in range(0, table_size):
        rgba = list(ctf.GetColor(float(i) / table_size))
        rgba.append(1)
        lut.SetTableValue(i, rgba)

    return lut


def get_diverging_lut1(start: str, mid: str, end: str, table_size: int = 256):
    """
    Create a diverging lookup table from three named colors.

    :param start: The start-point point color.
    :param mid: The mid-point color.
    :param end: The end-point color.
    :param table_size:  The table size.
    :return:
    """
    colors = vtkNamedColors()
    # Colour transfer function.
    ctf = vtkColorTransferFunction()
    ctf.SetColorSpaceToDiverging()
    p1 = [0.0] + list(colors.GetColor3d(start))
    p2 = [0.5] + list(colors.GetColor3d(mid))
    p3 = [1.0] + list(colors.GetColor3d(end))
    ctf.AddRGBPoint(*p1)
    ctf.AddRGBPoint(*p2)
    ctf.AddRGBPoint(*p3)

    lut = vtkLookupTable()
    lut.SetNumberOfTableValues(table_size)
    lut.Build()

    for i in range(0, table_size):
        rgba = list(ctf.GetColor(float(i) / table_size))
        rgba.append(1)
        lut.SetTableValue(i, rgba)

    return lut


if __name__ == '__main__':
    main()