CurvaturesDemo
Repository source: CurvaturesDemo
Description
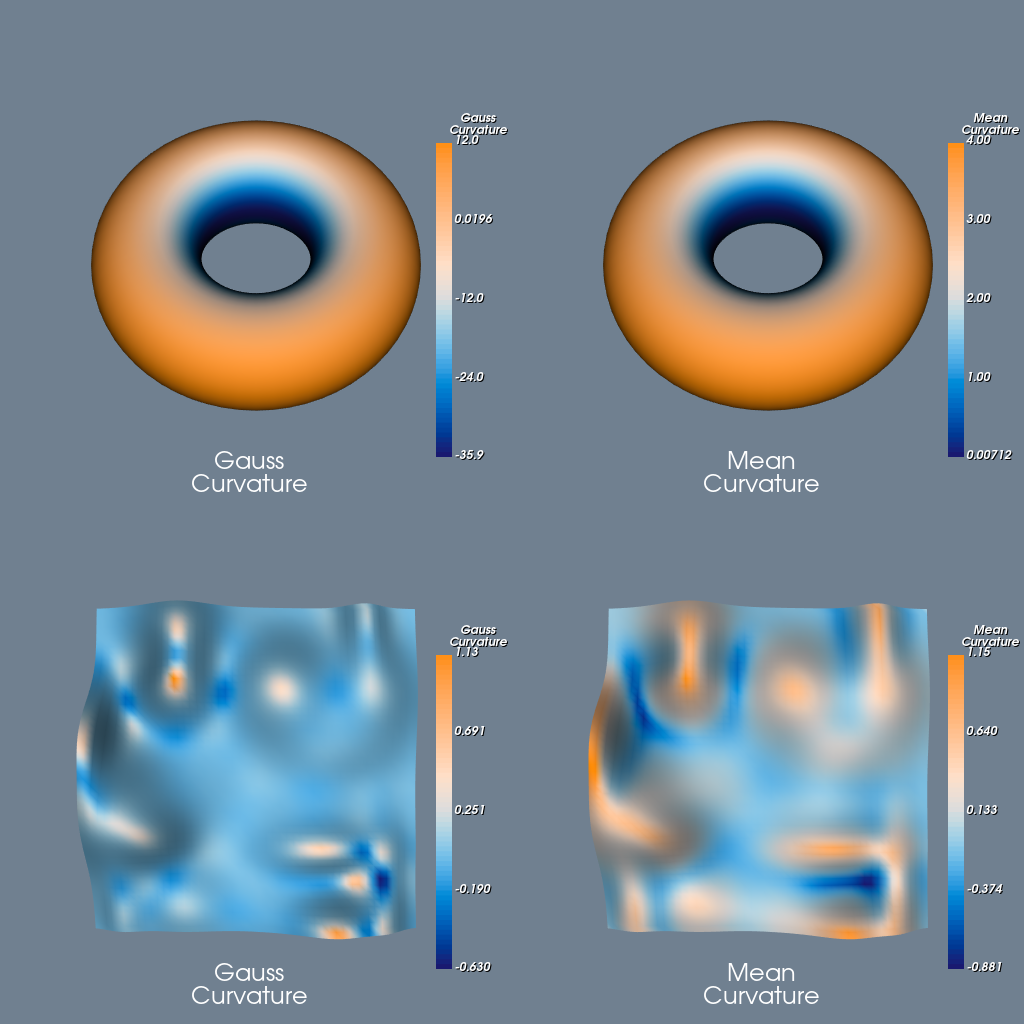
How to get the Gaussian and Mean curvatures of a surface.
Two different surfaces are used in this demonstration with each surface coloured according to its Gaussian and Mean curvatures.
-
The first surface is a superquadric surface, this demonstrates the use of extra filters that are needed to get a nice smooth surface.
-
The second surface is a parametric surface, in this case the surface has already been triangulated so no extra processing is necessary.
In order to get a nice coloured image, a vtkColorTransferFunction has been used to generate a set of colours for the vtkLookupTable tables. We have used a diverging colour space. Because of the symmetry of the ranges selected for the lookup tables, the white colouration represents a midpoint value whilst the blue represents values less than the midpoint value and orange represents colours greater than the midpoint value.
In the case of the Random Hills Gaussian curvature surface, this colouration shows the nature of the surface quite nicely. The blue areas are saddle points (negative Gaussian curvature) and the orange areas have a positive Gaussian curvature.
In the case of the mean curvature the blue colouration represents negative curvature perpendicular to one of the principal axes.
Other languages
See (Cxx)
Question
If you have a question about this example, please use the VTK Discourse Forum
Code
CurvaturesDemo.py
#!/usr/bin/env python

"""
The purpose of this is to demonstrate how to get the Gaussian and Mean curvatures of a surface.

Two different surfaces are used in this demonstration with each surface coloured according
 to its Gaussian and Mean curvatures.

The first surface is a superquadric surface, this demonstrates the use of extra filters
 that are needed to get a nice smooth surface.

The second surface is a parametric surface, in this case the surface has already been triangulated
so no extra processing is necessary.

In order to get a nice coloured image, a vtkColorTransferFunction has been used to generate
 a set of colours for the vtkLookUp tables. We have used a diverging colour space.
Because of the symmetry of the ranges selected for the lookup tables, the white colouration
 represents a midpoint value whilst the blue represents values less than the midopoint value
 and orange represents colours greater than the midpoint value.

In the case of the Random Hills Gaussian Curvature surface, this colouration shows the nature
 of the surface quite nicely. The blue areas are saddle points (negative Gaussian curvature)
 and the orange areas have a positive Gaussian curvature.
In the case of the mean curvature the blue colouration is representing negative curvature
 perpendicular to one of the principal axes.

This example also demonstrates the use of lists and the linking of the elements of the
 lists together to form a pipeline.

"""

import numpy as np
from vtkmodules.numpy_interface import dataset_adapter as dsa
from vtkmodules.vtkCommonColor import vtkNamedColors
from vtkmodules.vtkCommonComputationalGeometry import vtkParametricRandomHills
from vtkmodules.vtkCommonCore import (
    VTK_DOUBLE,
    vtkIdList,
    vtkLookupTable,
    vtkVersion
)
from vtkmodules.vtkCommonTransforms import vtkTransform
from vtkmodules.vtkFiltersCore import (
    vtkCleanPolyData,
    vtkFeatureEdges,
    vtkIdFilter,
    vtkTriangleFilter
)
from vtkmodules.vtkFiltersGeneral import (
    vtkCurvatures,
    vtkTransformFilter
)
from vtkmodules.vtkFiltersSources import (
    vtkParametricFunctionSource,
    vtkSuperquadricSource
)
from vtkmodules.vtkInteractionStyle import vtkInteractorStyleTrackballCamera
from vtkmodules.vtkRenderingAnnotation import vtkScalarBarActor
from vtkmodules.vtkRenderingCore import (
    vtkActor,
    vtkActor2D,
    vtkColorTransferFunction,
    vtkPolyDataMapper,
    vtkRenderWindow,
    vtkRenderWindowInteractor,
    vtkRenderer,
    vtkTextMapper,
    vtkTextProperty
)
from vtk.util import numpy_support


def main(argv):
    colors = vtkNamedColors()

    # We are going to handle two different sources.
    # The first source is a superquadric source.
    torus = vtkSuperquadricSource()
    torus.SetCenter(0.0, 0.0, 0.0)
    torus.SetScale(1.0, 1.0, 1.0)
    torus.SetPhiResolution(64)
    torus.SetThetaResolution(64)
    torus.SetThetaRoundness(1)
    torus.SetThickness(0.5)
    torus.SetSize(0.5)
    torus.SetToroidal(1)

    # Rotate the torus towards the observer (around the x-axis)
    toroid_transform = vtkTransform()
    toroid_transform.RotateX(55)

    toroid_transform_filter = vtkTransformFilter()
    toroid_transform_filter.SetInputConnection(torus.GetOutputPort())
    toroid_transform_filter.SetTransform(toroid_transform)

    # The quadric is made of strips, so pass it through a triangle filter as
    # the curvature filter only operates on polys
    tri = vtkTriangleFilter()
    tri.SetInputConnection(toroid_transform_filter.GetOutputPort())

    # The quadric has nasty discontinuities from the way the edges are generated
    # so let's pass it though a CleanPolyDataFilter and merge any points which
    # are coincident, or very close

    cleaner = vtkCleanPolyData()
    cleaner.SetInputConnection(tri.GetOutputPort())
    cleaner.SetTolerance(0.005)
    cleaner.Update()

    # The next source will be a parametric function
    rh = vtkParametricRandomHills()
    rh_fn_src = vtkParametricFunctionSource()
    rh_fn_src.SetParametricFunction(rh)
    rh_fn_src.Update()

    sources = list()
    for i in range(0, 4):
        cc = vtkCurvatures()
        if i < 2:
            cc.SetInputConnection(cleaner.GetOutputPort())
        else:
            cc.SetInputConnection(rh_fn_src.GetOutputPort())
        if i % 2 == 0:
            cc.SetCurvatureTypeToGaussian()
            curvature_name = 'Gauss_Curvature'
        else:
            cc.SetCurvatureTypeToMean()
            curvature_name = 'Mean_Curvature'
        cc.Update()
        adjust_edge_curvatures(cc.GetOutput(), curvature_name)
        sources.append(cc.GetOutput())

    curvatures = {
        0: 'Gauss_Curvature',
        1: 'Mean_Curvature',
        2: 'Gauss_Curvature',
        3: 'Mean_Curvature',
    }

    # lut = get_diverging_lut()
    lut = get_diverging_lut1()

    renderers = list()
    mappers = list()
    actors = list()
    text_mappers = list()
    text_actors = list()
    scalar_bars = list()

    # Create a common text property.
    text_property = vtkTextProperty()
    text_property.SetFontSize(24)
    text_property.SetJustificationToCentered()

    # RenderWindow Dimensions
    #
    renderer_size = 512
    grid_dimensions = 2
    window_width = renderer_size * grid_dimensions
    window_height = renderer_size * grid_dimensions

    # Link the pipeline together.
    for idx, source in enumerate(sources):
        curvature_name = curvatures[idx].replace('_', '\n')

        source.GetPointData().SetActiveScalars(curvatures[idx])
        scalar_range = source.GetPointData().GetScalars(curvatures[idx]).GetRange()

        mappers.append(vtkPolyDataMapper())
        mappers[idx].SetInputData(source)
        mappers[idx].SetScalarModeToUsePointFieldData()
        mappers[idx].SelectColorArray(curvatures[idx])
        mappers[idx].SetScalarRange(scalar_range)
        mappers[idx].SetLookupTable(lut)

        actors.append(vtkActor())
        actors[idx].SetMapper(mappers[idx])

        text_mappers.append(vtkTextMapper())
        text_mappers[idx].SetInput(curvature_name)
        text_mappers[idx].SetTextProperty(text_property)

        text_actors.append(vtkActor2D())
        text_actors[idx].SetMapper(text_mappers[idx])
        text_actors[idx].SetPosition(250, 16)

        # Create a scalar bar
        scalar_bars.append(vtkScalarBarActor())
        scalar_bars[idx].SetLookupTable(mappers[idx].GetLookupTable())
        scalar_bars[idx].SetTitle(curvature_name)
        scalar_bars[idx].UnconstrainedFontSizeOn()
        scalar_bars[idx].SetNumberOfLabels(5)
        scalar_bars[idx].SetMaximumWidthInPixels(window_width // 8)
        scalar_bars[idx].SetMaximumHeightInPixels(window_height // 3)
        scalar_bars[idx].SetBarRatio(scalar_bars[idx].GetBarRatio() * 0.5)
        scalar_bars[idx].SetPosition(0.85, 0.1)

        renderers.append(vtkRenderer())

    for idx in range(len(sources)):
        if idx < grid_dimensions * grid_dimensions:
            renderers.append(vtkRenderer)

    # Create the RenderWindow
    #
    render_window = vtkRenderWindow()
    render_window.SetSize(renderer_size * grid_dimensions, renderer_size * grid_dimensions)
    render_window.SetWindowName('CurvaturesDemo')

    # Add and position the renders to the render window.
    viewport = list()
    for row in range(grid_dimensions):
        for col in range(grid_dimensions):
            idx = row * grid_dimensions + col

            viewport[:] = []
            viewport.append(float(col) / grid_dimensions)
            viewport.append(float(grid_dimensions - (row + 1)) / grid_dimensions)
            viewport.append(float(col + 1) / grid_dimensions)
            viewport.append(float(grid_dimensions - row) / grid_dimensions)

            if idx > (len(sources) - 1):
                continue

            renderers[idx].SetViewport(viewport)
            render_window.AddRenderer(renderers[idx])

            renderers[idx].AddActor(actors[idx])
            renderers[idx].AddActor(text_actors[idx])
            renderers[idx].AddActor(scalar_bars[idx])
            renderers[idx].SetBackground(colors.GetColor3d('SlateGray'))

    interactor = vtkRenderWindowInteractor()
    interactor.SetRenderWindow(render_window)
    style = vtkInteractorStyleTrackballCamera()
    interactor.SetInteractorStyle(style)

    render_window.Render()

    interactor.Start()


def get_diverging_lut():
    """
    See: [Diverging Color Maps for Scientific Visualization](https://www.kennethmoreland.com/color-maps/)
                       start point         midPoint            end point
     cool to warm:     0.230, 0.299, 0.754 0.865, 0.865, 0.865 0.706, 0.016, 0.150
     purple to orange: 0.436, 0.308, 0.631 0.865, 0.865, 0.865 0.759, 0.334, 0.046
     green to purple:  0.085, 0.532, 0.201 0.865, 0.865, 0.865 0.436, 0.308, 0.631
     blue to brown:    0.217, 0.525, 0.910 0.865, 0.865, 0.865 0.677, 0.492, 0.093
     green to red:     0.085, 0.532, 0.201 0.865, 0.865, 0.865 0.758, 0.214, 0.233

    :return:
    """
    ctf = vtkColorTransferFunction()
    ctf.SetColorSpaceToDiverging()
    # Cool to warm.
    ctf.AddRGBPoint(0.0, 0.230, 0.299, 0.754)
    ctf.AddRGBPoint(0.5, 0.865, 0.865, 0.865)
    ctf.AddRGBPoint(1.0, 0.706, 0.016, 0.150)

    table_size = 256
    lut = vtkLookupTable()
    lut.SetNumberOfTableValues(table_size)
    lut.Build()

    for i in range(0, table_size):
        rgba = list(ctf.GetColor(float(i) / table_size))
        rgba.append(1)
        lut.SetTableValue(i, rgba)

    return lut


def get_diverging_lut1():
    colors = vtkNamedColors()
    # Colour transfer function.
    ctf = vtkColorTransferFunction()
    ctf.SetColorSpaceToDiverging()
    p1 = [0.0] + list(colors.GetColor3d('MidnightBlue'))
    p2 = [0.5] + list(colors.GetColor3d('Gainsboro'))
    p3 = [1.0] + list(colors.GetColor3d('DarkOrange'))
    ctf.AddRGBPoint(*p1)
    ctf.AddRGBPoint(*p2)
    ctf.AddRGBPoint(*p3)

    table_size = 256
    lut = vtkLookupTable()
    lut.SetNumberOfTableValues(table_size)
    lut.Build()

    for i in range(0, table_size):
        rgba = list(ctf.GetColor(float(i) / table_size))
        rgba.append(1)
        lut.SetTableValue(i, rgba)

    return lut


def vtk_version_ok(major, minor, build):
    """
    Check the VTK version.

    :param major: Requested major version.
    :param minor: Requested minor version.
    :param build: Requested build version.
    :return: True if the requested VTK version is >= the actual VTK version.
    """
    requested_version = (100 * int(major) + int(minor)) * 100000000 + int(build)
    ver = vtkVersion()
    actual_version = (100 * ver.GetVTKMajorVersion() + ver.GetVTKMinorVersion()) \
                     * 100000000 + ver.GetVTKBuildVersion()
    if actual_version >= requested_version:
        return True
    else:
        return False


def adjust_edge_curvatures(source, curvature_name, epsilon=1.0e-08):
    """
    This function adjusts curvatures along the edges of the surface by replacing
     the value with the average value of the curvatures of points in the neighborhood.

    Remember to update the vtkCurvatures object before calling this.

    :param source: A vtkPolyData object corresponding to the vtkCurvatures object.
    :param curvature_name: The name of the curvature, 'Gauss_Curvature' or 'Mean_Curvature'.
    :param epsilon: Absolute curvature values less than this will be set to zero.
    :return:
    """

    def point_neighbourhood(pt_id):
        """
        Find the ids of the neighbours of pt_id.

        :param pt_id: The point id.
        :return: The neighbour ids.
        """
        """
        Extract the topological neighbors for point pId. In two steps:
        1) source.GetPointCells(pt_id, cell_ids)
        2) source.GetCellPoints(cell_id, cell_point_ids) for all cell_id in cell_ids
        """
        cell_ids = vtkIdList()
        source.GetPointCells(pt_id, cell_ids)
        neighbour = set()
        for cell_idx in range(0, cell_ids.GetNumberOfIds()):
            cell_id = cell_ids.GetId(cell_idx)
            cell_point_ids = vtkIdList()
            source.GetCellPoints(cell_id, cell_point_ids)
            for cell_pt_idx in range(0, cell_point_ids.GetNumberOfIds()):
                neighbour.add(cell_point_ids.GetId(cell_pt_idx))
        return neighbour

    def compute_distance(pt_id_a, pt_id_b):
        """
        Compute the distance between two points given their ids.

        :param pt_id_a:
        :param pt_id_b:
        :return:
        """
        pt_a = np.array(source.GetPoint(pt_id_a))
        pt_b = np.array(source.GetPoint(pt_id_b))
        return np.linalg.norm(pt_a - pt_b)

    # Get the active scalars
    source.GetPointData().SetActiveScalars(curvature_name)
    np_source = dsa.WrapDataObject(source)
    curvatures = np_source.PointData[curvature_name]

    #  Get the boundary point IDs.
    array_name = 'ids'
    id_filter = vtkIdFilter()
    id_filter.SetInputData(source)
    id_filter.SetPointIds(True)
    id_filter.SetCellIds(False)
    id_filter.SetPointIdsArrayName(array_name)
    id_filter.SetCellIdsArrayName(array_name)
    id_filter.Update()

    edges = vtkFeatureEdges()
    edges.SetInputConnection(id_filter.GetOutputPort())
    edges.BoundaryEdgesOn()
    edges.ManifoldEdgesOff()
    edges.NonManifoldEdgesOff()
    edges.FeatureEdgesOff()
    edges.Update()

    edge_array = edges.GetOutput().GetPointData().GetArray(array_name)
    boundary_ids = []
    for i in range(edges.GetOutput().GetNumberOfPoints()):
        boundary_ids.append(edge_array.GetValue(i))
    # Remove duplicate Ids.
    p_ids_set = set(boundary_ids)

    # Iterate over the edge points and compute the curvature as the weighted
    # average of the neighbours.
    count_invalid = 0
    for p_id in boundary_ids:
        p_ids_neighbors = point_neighbourhood(p_id)
        # Keep only interior points.
        p_ids_neighbors -= p_ids_set
        # Compute distances and extract curvature values.
        curvs = [curvatures[p_id_n] for p_id_n in p_ids_neighbors]
        dists = [compute_distance(p_id_n, p_id) for p_id_n in p_ids_neighbors]
        curvs = np.array(curvs)
        dists = np.array(dists)
        curvs = curvs[dists > 0]
        dists = dists[dists > 0]
        if len(curvs) > 0:
            weights = 1 / np.array(dists)
            weights /= weights.sum()
            new_curv = np.dot(curvs, weights)
        else:
            # Corner case.
            count_invalid += 1
            # Assuming the curvature of the point is planar.
            new_curv = 0.0
        # Set the new curvature value.
        curvatures[p_id] = new_curv

    #  Set small values to zero.
    if epsilon != 0.0:
        curvatures = np.where(abs(curvatures) < epsilon, 0, curvatures)
        # Curvatures is now an ndarray
        curv = numpy_support.numpy_to_vtk(num_array=curvatures.ravel(),
                                          deep=True,
                                          array_type=VTK_DOUBLE)
        curv.SetName(curvature_name)
        source.GetPointData().RemoveArray(curvature_name)
        source.GetPointData().AddArray(curv)
        source.GetPointData().SetActiveScalars(curvature_name)


if __name__ == '__main__':
    import sys

    main(sys.argv)