CSVReadEdit
Repository source: CSVReadEdit

Description
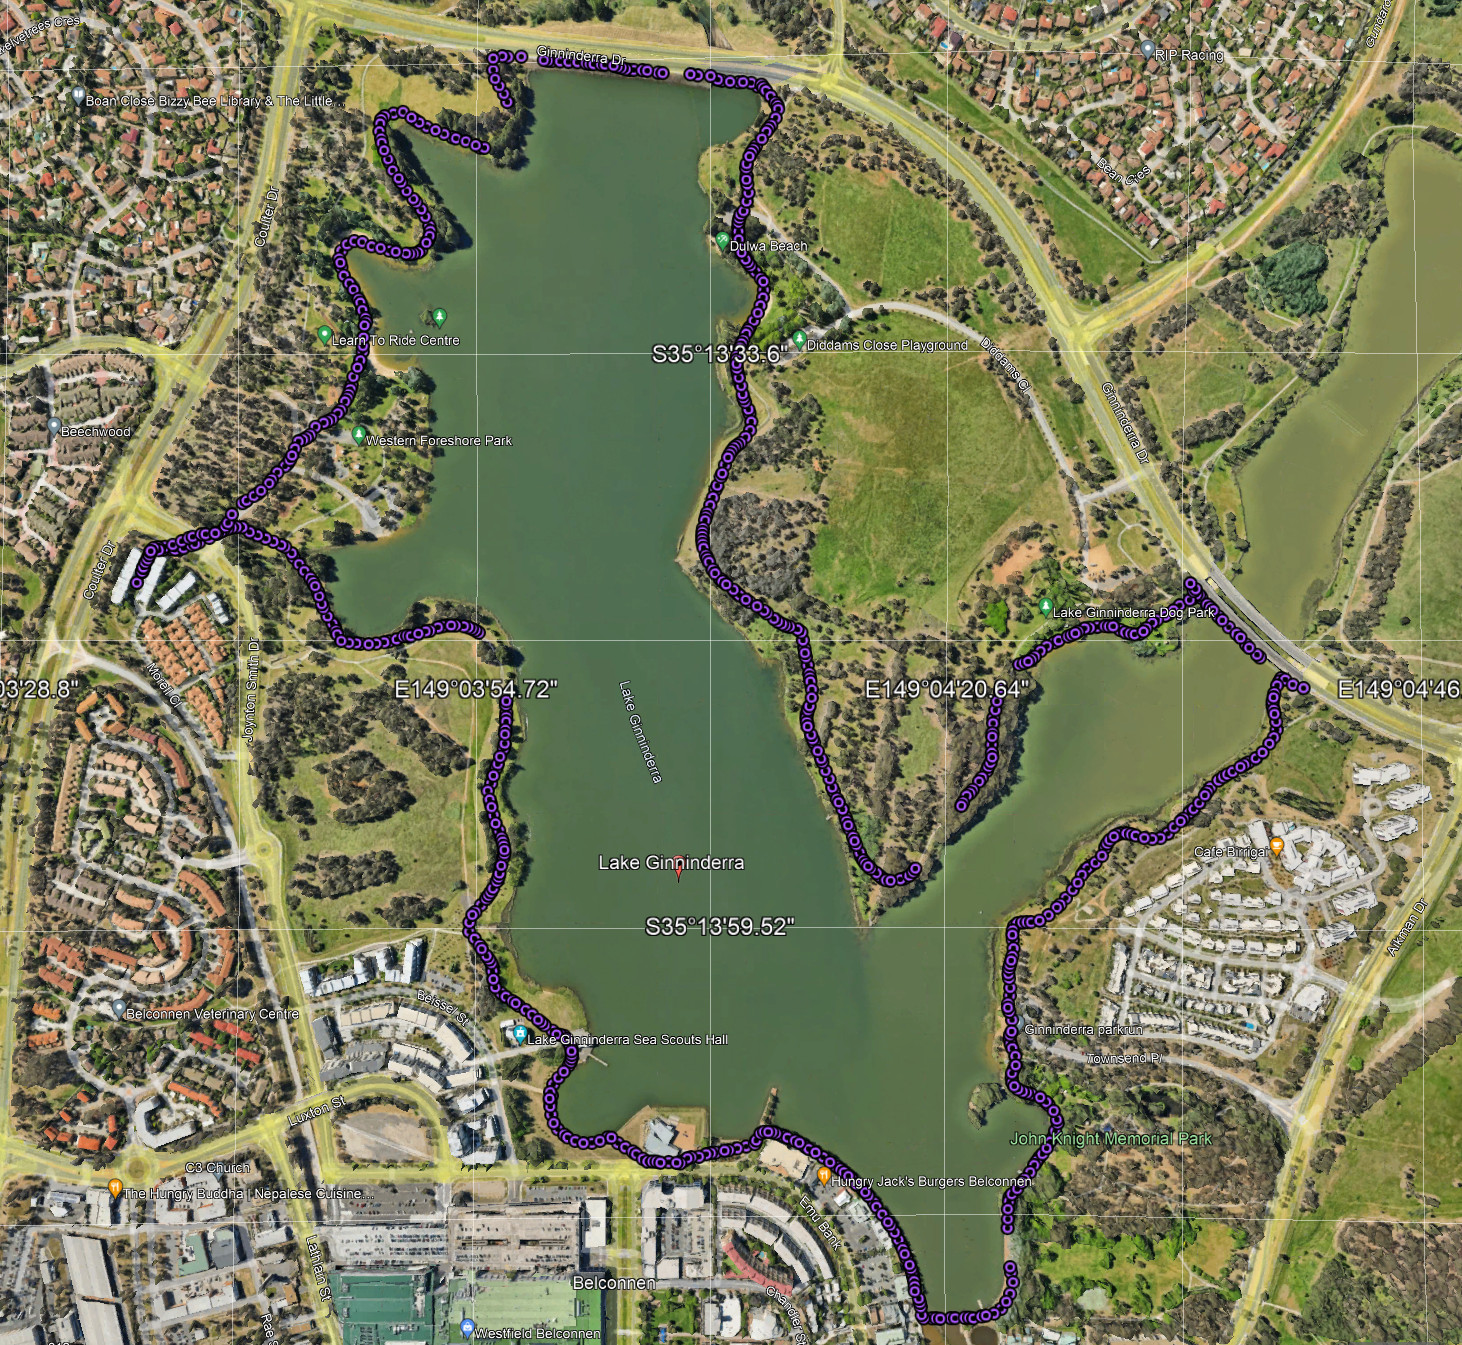
This example loads a CSV file, edits it, then visualizes the result.
It demonstrates the use of pandas to read and edit the CSV input file, then uses numpy via the vtk-numpy interface for building the resultant vtkPolyData object based on the options selected.
The key thing about pandas is it can read/write data in various formats: CSV and text files, Microsoft Excel, SQL databases, and the fast HDF5 format. It is highly optimized for performance and the DataFrame object allows for extensive row/column manipulation. So we can edit the data, creating new columns, and, finally, select only relevant columns for further analysis by VTK.
In this case we select columns using numpy to create the three-dimensional point data array data. The numpy objects are then converted to vtk data structures and integrated into a vtkPolyData object.
The process is this:
CSV->pandas(read/edit/select)->numpy->numpy_to_vtk->vtkPolyData
Note how easy it is the get the three-dimensional coordinates using numpy.
The files used to generate the example are:
<DATA>/LakeGininderra.csv
<DATA>/LakeGininderra.kmz
Where:
<DATA>is the path tovtk-examples/src/Testing/DataLakeGininderra.csvis the CSV file used by this program.LakeGininderra.kmzcan be loaded into Google Earth to display the track.
Note that LakeGininderra.csv contains the Geographic, UTM and ECEF coordinates.
The parameters for typical usage are something like this:
<DATA>/LakeGininderra.csv -u -c -pResults
There are options available to output the data as a CSV or VTP file that can then be read into ParaView for further processing.
Further information:
Other languages
See (Python)
Question
If you have a question about this example, please use the VTK Discourse Forum
Code
CSVReadEdit.py
#!/usr/bin/env python3

from dataclasses import dataclass
from pathlib import Path

import pandas as pd
# noinspection PyUnresolvedReferences
import vtkmodules.vtkInteractionStyle
# noinspection PyUnresolvedReferences
import vtkmodules.vtkRenderingOpenGL2
from vtk.util import numpy_support
from vtkmodules.vtkCommonColor import (
    vtkNamedColors
)
from vtkmodules.vtkCommonCore import vtkPoints, vtkStringArray
from vtkmodules.vtkCommonDataModel import (
    vtkCellArray,
    vtkPolyData,
    vtkPolyLine
)
from vtkmodules.vtkCommonTransforms import vtkTransform
from vtkmodules.vtkFiltersGeneral import vtkTransformPolyDataFilter
from vtkmodules.vtkIOXML import vtkXMLPolyDataWriter, vtkXMLWriterBase
from vtkmodules.vtkInteractionWidgets import vtkCameraOrientationWidget, vtkOrientationMarkerWidget
from vtkmodules.vtkRenderingAnnotation import vtkAxesActor, vtkScalarBarActor
from vtkmodules.vtkRenderingCore import (
    vtkActor,
    vtkDiscretizableColorTransferFunction,
    vtkPolyDataMapper,
    vtkRenderWindow,
    vtkRenderWindowInteractor,
    vtkRenderer
)


def get_program_parameters():
    import argparse
    description = 'Edit data from a CSV file and visualise it.'
    epilogue = '''
    This program selects ECEF, Geographic or UTM coordinates from the input file and:
       1) Visualises the resultant ECEF or UTM points and lines.
       2) If ECEF or UTM is selected, optionally creates and saves a VTP file for further analysis.
       3) Optionally saves the CSV file.
    If Geographic coordinates are selected, only the resultant CSV file can be saved.
    '''
    parser = argparse.ArgumentParser(description=description, epilog=epilogue,
                                     formatter_class=argparse.RawTextHelpFormatter)
    parser.add_argument('file_name', help='The CSV file containing the data.')
    parser.add_argument('-c', '--csv', action='store_true', help='Save the resultant CSV file.')
    parser.add_argument('-v', '--vtp', action='store_true', help='Save the .vtp file.')
    parser.add_argument('-p', '--path', default='.',
                        help='The path to be appended to the .vtp and optional .csv file')
    parser.add_argument('-s', '--scale', type=float, default=1.0,
                        help='Multiply the elevation by a scalar, default=1.0.')

    group = parser.add_mutually_exclusive_group(required=True)
    group.add_argument('-e', '--ecef', action='store_true', help='Use ECEF coordinates.')
    group.add_argument('-u', '--utm', action='store_true', help='Use UTM coordinates.')
    group.add_argument('-g', '--geo', action='store_true', help='Use geographic coordinates (latitude/longitude).')

    args = parser.parse_args()
    return args.file_name, args.csv, args.vtp, args.path, args.scale, args.ecef, args.utm, args.geo


def main():
    ifn, csv, vtp, sp, elev_scale, ecef, utm, geo = get_program_parameters()
    if elev_scale == 0.0:
        print('The elevation scale multiplier cannot be zero.')
        return
    file_name = Path(ifn)
    if not file_name.is_file():
        print('Unable to read:', file_name)
        return
    pth = Path(sp)
    if not pth.is_dir():
        if pth.is_file():
            print(sp, ' must be a path')
            return
    pth.mkdir(parents=True, exist_ok=True)

    # Build the output paths.
    csv_fn = Path(pth / Path(ifn).stem).with_suffix('.csv')
    vtp_fn = Path(pth / Path(ifn).stem).with_suffix('.vtp')
    if ecef:
        vtp_fn = vtp_fn.with_stem(vtp_fn.stem + '_ecef')
    if utm:
        vtp_fn = vtp_fn.with_stem(vtp_fn.stem + '_utm')

    # Create a DataFrame from the csv file.
    df = pd.read_csv(file_name)

    # Use the column called 'Index' as the index.
    # This ensures that we can trace back each row to the original data.
    df.set_index('Index', inplace=True)

    # For ECEF coordinates, we want to look down from the zenith.
    # So calculate the mid-point of the latitude.
    lat_details = df['Latitude'].describe()
    lat_mid_pt = (lat_details['max'] + lat_details['min']) / 2

    # Copy what we want to the new DataFrame and drop any rows with missing values.
    if ecef:
        dfv = df[['X(m)', 'Y(m)', 'Z(m)', 'Elevation(m)']].dropna(
            subset=['X(m)', 'Y(m)', 'Z(m)', 'Elevation(m)'])
        if csv:
            ecef_csv_fn = csv_fn.with_stem(csv_fn.stem + '_ecef')
            dfv.to_csv(ecef_csv_fn, index=True, index_label='Index', header=True)

    elif utm:
        dfv = df[['Zone', 'Easting(m)', 'Northing(m)', 'Elevation(m)']].dropna(
            subset=['Zone', 'Easting(m)', 'Northing(m)', 'Elevation(m)'])
        if csv:
            utm_csv_fn = csv_fn.with_stem(csv_fn.stem + '_utm')
            dfv.to_csv(utm_csv_fn, index=True, index_label='Index', header=True)
    else:
        dfv = df[['Longitude', 'Latitude', 'Elevation(m)']].dropna(
            subset=['Longitude', 'Latitude', 'Elevation(m)'])
        geo_csv_fn = csv_fn.with_stem(csv_fn.stem + '_geo')
        dfv.to_csv(geo_csv_fn, index=True, index_label='Index', header=True)

    if dfv.empty:
        print('No data in the processed dataframe, please check:', file_name)
        return

    # This is used to color the elevation.
    dfv_elev = dfv[['Elevation(m)']].to_numpy()
    elev_range = (dfv['Elevation(m)'].min(), dfv['Elevation(m)'].max())
    # The index.
    dfv_index = dfv.index.to_numpy()

    if ecef:
        xyz = dfv[['X(m)', 'Y(m)', 'Z(m)']].to_numpy()
    elif utm:
        # Multiply the elevation by a scalar.
        dfv['Elevation(m)'] = dfv['Elevation(m)'] * elev_scale
        xyz = dfv[['Easting(m)', 'Northing(m)', 'Elevation(m)']].to_numpy()
    else:
        print('Only ECEF or UTM coordinates can be visualised.')
        return

    # Create the poly data from the dataframe.
    points = vtkPoints(data=numpy_support.numpy_to_vtk(xyz))
    poly_data = vtkPolyData(points=points)

    # Set an index.
    idx = numpy_support.numpy_to_vtk(dfv_index)
    idx.name = 'Index'
    poly_data.point_data.AddArray(idx)

    if utm:
        dfv_zone = dfv['Zone'].tolist()
        array = vtkStringArray()
        for zone in dfv_zone:
            array.InsertNextValue(zone)
        array.name = 'Zone'
        poly_data.point_data.AddArray(array)

    if ecef:
        # We need to add the elevation.
        elevation = numpy_support.numpy_to_vtk(dfv[['Elevation(m)']].to_numpy())
        elevation.name = 'Elevation(m)'
        poly_data.point_data.AddArray(elevation)

    # We use the unmodified elevation as the active scalars.
    scal = numpy_support.numpy_to_vtk(dfv_elev)
    scal.name = 'Elev'
    poly_data.point_data.SetScalars(scal)
    poly_data.point_data.SetActiveScalars(scal.name)

    num_pts = poly_data.number_of_points
    poly_line = vtkPolyLine()
    poly_line.point_ids.number_of_ids = num_pts
    for i in range(0, num_pts):
        poly_line.point_ids.SetId(i, i)

    # Create a cell array to store the lines in and add the lines to it.
    cells = vtkCellArray()
    cells.InsertNextCell(poly_line)

    # Add the lines to the dataset.
    poly_data.SetLines(cells)

    # print(poly_data)

    # Apply a transform to map the coordinates into the VTK coordinate system.
    transform = vtkTransform()
    if utm:
        # Scale the elevation.
        transform.Scale(1, 1, 1)
    if ecef:
        # Rotate the ECEF coordinates into VTK
        # coordinates so that on the screen:
        # Y points North, X points East and Z points up.
        transform.RotateX(-(90 - lat_mid_pt))
        transform.RotateY(0)
        transform.RotateZ(90 - lat_mid_pt)

    transform_filter = vtkTransformPolyDataFilter(transform=transform, input_data=poly_data)

    if vtp:
        writer = vtkXMLPolyDataWriter(file_name=vtp_fn, data_mode=vtkXMLWriterBase.Binary,
                                      input_connection=transform_filter.output_port)
        writer.Write()

    colors = vtkNamedColors()
    colors.SetColor('ParaViewBlueGrayBkg', 84, 89, 109, 255)
    colors.SetColor('ParaViewWarmGrayBkg', 98, 93, 90, 255)

    ctf = get_ctf()
    # Rescale the color transfer function to the elevation range.
    rescaled_ctf = rescale_ctf(ctf, new_min=elev_range[0], new_max=elev_range[1], reverse=False)
    rescaled_ctf.discretize = False

    mapper = vtkPolyDataMapper(input_connection=transform_filter.output_port,
                               lookup_table=rescaled_ctf,
                               color_mode=Mapper.ColorMode.VTK_COLOR_MODE_MAP_SCALARS,
                               scalar_range=elev_range, scalar_visibility=True,
                               interpolate_scalars_before_mapping=True)

    actor = vtkActor(mapper=mapper)
    actor.property.line_width = 3

    window_width = 1024
    window_height = 1024

    # Create a scalar bar.
    scalar_bar = vtkScalarBarActor(lookup_table=mapper.lookup_table,
                                   title='Elevation',
                                   unconstrained_font_size=False,
                                   number_of_labels=6,
                                   vertical_title_separation=50,
                                   maximum_width_in_pixels=window_width // 8,
                                   maximum_height_in_pixels=window_height // 2,
                                   position=(0.87, 0.1)
                                   )
    scalar_bar.bar_ratio = scalar_bar.bar_ratio * 0.5

    ren = vtkRenderer(background=colors.GetColor3d('ParaViewWarmGrayBkg'))
    ren_win = vtkRenderWindow(size=(window_width, window_height))
    ren_win.AddRenderer(ren)
    if ecef:
        ren_win.window_name = 'CSVReadEdit ECEF'
    elif utm:
        ren_win.window_name = 'CSVReadEdit UTM'
    iren = vtkRenderWindowInteractor()
    iren.render_window = ren_win
    # Since we import vtkmodules.vtkInteractionStyle we can do this
    # because vtkInteractorStyleSwitch is automatically imported:
    iren.interactor_style.SetCurrentStyleToTrackballCamera()

    ren.AddActor(actor)
    ren.AddActor(scalar_bar)

    cow = vtkCameraOrientationWidget(parent_renderer=ren)
    cow.representation.SetXPlusLabelText('E')
    cow.representation.SetXMinusLabelText('W')
    cow.representation.SetYPlusLabelText('N')
    cow.representation.SetYMinusLabelText('S')
    cow.representation.SetZPlusLabelText('Z')
    cow.representation.SetZMinusLabelText('-Z')  # Cannot use Nadir as N is used for North, so use -Z.
    cow.On()

    axes = vtkAxesActor()
    axes.SetXAxisLabelText('East')
    axes.SetYAxisLabelText('North')
    axes.SetZAxisLabelText('Zenith')

    rgba = [0.0] * 4
    colors.GetColor("Carrot", rgba)
    rgb = tuple(rgba[:3])
    widget = vtkOrientationMarkerWidget(orientation_marker=axes,
                                        interactor=iren, default_renderer=ren,
                                        outline_color=rgb, viewport=(0.0, 0.0, 0.2, 0.2),
                                        enabled=True, interactive=True, zoom=1.0)

    ren.ResetCamera()
    ren_win.Render()

    iren.Start()


def get_ctf():
    # name: Fast, creator: Francesca Samsel, and Alan W. Scott
    # interpolationspace: Lab, space: rgb
    # file name: Fast.json

    ctf = vtkDiscretizableColorTransferFunction(color_space=ColorTransferFunction.ColorSpace.VTK_CTF_LAB,
                                                scale=ColorTransferFunction.Scale.VTK_CTF_LINEAR,
                                                nan_color=(0.0, 1.0, 0.0),
                                                number_of_values=9, discretize=False)

    ctf.AddRGBPoint(0, 0.05639999999999999, 0.05639999999999999, 0.47)
    ctf.AddRGBPoint(0.17159223942480895, 0.24300000000000013, 0.4603500000000004, 0.81)
    ctf.AddRGBPoint(0.2984914818394138, 0.3568143826543521, 0.7450246485363142, 0.954367702893722)
    ctf.AddRGBPoint(0.4321287371255907, 0.6882, 0.93, 0.9179099999999999)
    ctf.AddRGBPoint(0.5, 0.8994959551205902, 0.944646394975174, 0.7686567142818399)
    ctf.AddRGBPoint(0.5882260353170073, 0.957107977357604, 0.8338185108985666, 0.5089156299842102)
    ctf.AddRGBPoint(0.7061412605695164, 0.9275207599610714, 0.6214389091739178, 0.31535705838676426)
    ctf.AddRGBPoint(0.8476395308725272, 0.8, 0.3520000000000001, 0.15999999999999998)
    ctf.AddRGBPoint(1, 0.59, 0.07670000000000013, 0.11947499999999994)

    return ctf


def generate_new_ctf(old_ctf, new_x, new_rgb, reverse=False):
    """
    Generate a new color transfer function from the old one,
    adding in the new x and rgb values.

    :param old_ctf: The old color transfer function.
    :param new_x: The new color x-values.
    :param new_rgb: The color RGB values.
    :param reverse: If true, reverse the colors.
    :return: The new color transfer function.
    """
    new_ctf = vtkDiscretizableColorTransferFunction(color_space=old_ctf.color_space, scale=old_ctf.scale,
                                                    nan_color=old_ctf.nan_color,
                                                    number_of_values=len(new_x), discretize=False
                                                    )
    if not reverse:
        new_ctf.below_range_color = old_ctf.below_range_color
        new_ctf.use_below_range_color = old_ctf.use_below_range_color
        new_ctf.above_range_color = old_ctf.above_range_color
        new_ctf.use_above_range_color = old_ctf.use_above_range_color
    else:
        new_ctf.below_range_color = old_ctf.above_range_color
        new_ctf.use_below_range_color = old_ctf.use_above_range_color
        new_ctf.above_range_color = old_ctf.below_range_color
        new_ctf.use_above_range_color = old_ctf.use_below_range_color

    if not reverse:
        for i in range(0, len(new_x)):
            new_ctf.AddRGBPoint(new_x[i], *new_rgb[i])
    else:
        sz = len(new_x)
        for i in range(0, sz):
            j = sz - (i + 1)
            new_ctf.AddRGBPoint(new_x[i], *new_rgb[j])

    new_ctf.Build()
    return new_ctf


def rescale(values, new_min=0, new_max=1):
    """
    Rescale the values.

    See: https://stats.stackexchange.com/questions/25894/changing-the-scale-of-a-variable-to-0-100

    :param values: The values to be rescaled.
    :param new_min: The new minimum value.
    :param new_max: The new maximum value.
    :return: The rescaled values.
    """
    res = list()
    old_min, old_max = min(values), max(values)
    for v in values:
        new_v = (new_max - new_min) / (old_max - old_min) * (v - old_min) + new_min
        # new_v1 = (new_max - new_min) / (old_max - old_min) * (v - old_max) + new_max
        res.append(new_v)
    return res


def rescale_ctf(ctf, new_min=0, new_max=1, reverse=False):
    """
    Rescale and, optionally, reverse the colors in the color transfer function.

    :param ctf: The color transfer function to rescale.
    :param new_min: The new minimum value.
    :param new_max: The new maximum value.
    :param reverse: If true, reverse the colors.
    :return: The rescaled color transfer function.
    """
    if new_min > new_max:
        r0 = new_max
        r1 = new_min
    else:
        r0 = new_min
        r1 = new_max

    xv = list()
    rgbv = list()
    nv = [0] * 6
    for i in range(0, ctf.GetNumberOfValues()):
        ctf.GetNodeValue(i, nv)
        x = nv[0]
        rgb = nv[1:4]
        xv.append(x)
        rgbv.append(rgb)
    xvr = rescale(xv, r0, r1)

    return generate_new_ctf(ctf, xvr, rgbv, reverse=reverse)


@dataclass(frozen=True)
class ColorTransferFunction:
    @dataclass(frozen=True)
    class ColorSpace:
        VTK_CTF_RGB: int = 0
        VTK_CTF_HSV: int = 1
        VTK_CTF_LAB: int = 2
        VTK_CTF_DIVERGING: int = 3
        VTK_CTF_LAB_CIEDE2000: int = 4
        VTK_CTF_STEP: int = 5

    @dataclass(frozen=True)
    class Scale:
        VTK_CTF_LINEAR: int = 0
        VTK_CTF_LOG10: int = 1


@dataclass(frozen=True)
class Mapper:
    @dataclass(frozen=True)
    class ColorMode:
        VTK_COLOR_MODE_DEFAULT: int = 0
        VTK_COLOR_MODE_MAP_SCALARS: int = 1
        VTK_COLOR_MODE_DIRECT_SCALARS: int = 2

    @dataclass(frozen=True)
    class ResolveCoincidentTopology:
        VTK_RESOLVE_OFF: int = 0
        VTK_RESOLVE_POLYGON_OFFSET: int = 1
        VTK_RESOLVE_SHIFT_ZBUFFER: int = 2

    @dataclass(frozen=True)
    class ScalarMode:
        VTK_SCALAR_MODE_DEFAULT: int = 0
        VTK_SCALAR_MODE_USE_POINT_DATA: int = 1
        VTK_SCALAR_MODE_USE_CELL_DATA: int = 2
        VTK_SCALAR_MODE_USE_POINT_FIELD_DATA: int = 3
        VTK_SCALAR_MODE_USE_CELL_FIELD_DATA: int = 4
        VTK_SCALAR_MODE_USE_FIELD_DATA: int = 5


if __name__ == '__main__':
    main()